File list
Jump to navigation
Jump to search
This special page shows all uploaded files.
| Date | Name | Thumbnail | Size | User | Description | Versions |
|---|---|---|---|---|---|---|
| 11:03, 31 July 2010 | 5-1norm prob.png (file) |  |
12 KB | Statadmin (talk | contribs) | These plots indicate that our data is sufficiently gaussian and we can believe the results of our hypothesis testing. | 1 |
| 11:02, 31 July 2010 | 5-1dataplot.png (file) |  |
13 KB | Statadmin (talk | contribs) | This plot illustrates the various effects on the data in problem 5-1. The hats (^) indicate that these are approximate effects calculated from our sample data. | 1 |
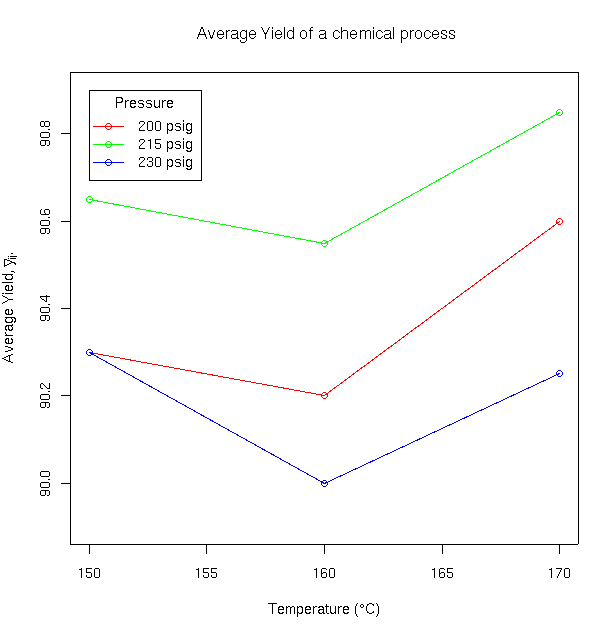
| 11:01, 31 July 2010 | 5-1yield.png (file) |  |
9 KB | Statadmin (talk | contribs) | This plot of yield vs. pressure, at the different levels of temperature, helps to visualize the different effects in our problem. | 1 |
| 10:59, 31 July 2010 | 4-1dataplot.png (file) |  |
93 KB | Statadmin (talk | contribs) | 1 | |
| 10:39, 31 July 2010 | 3-1fake4.png (file) |  |
9 KB | Statadmin (talk | contribs) | Confidence interval on the differences in means. | 1 |
| 10:39, 31 July 2010 | 3-1fake3.png (file) |  |
9 KB | Statadmin (talk | contribs) | Confidence interval on the mean tensile strength for each mixing technique. | 1 |
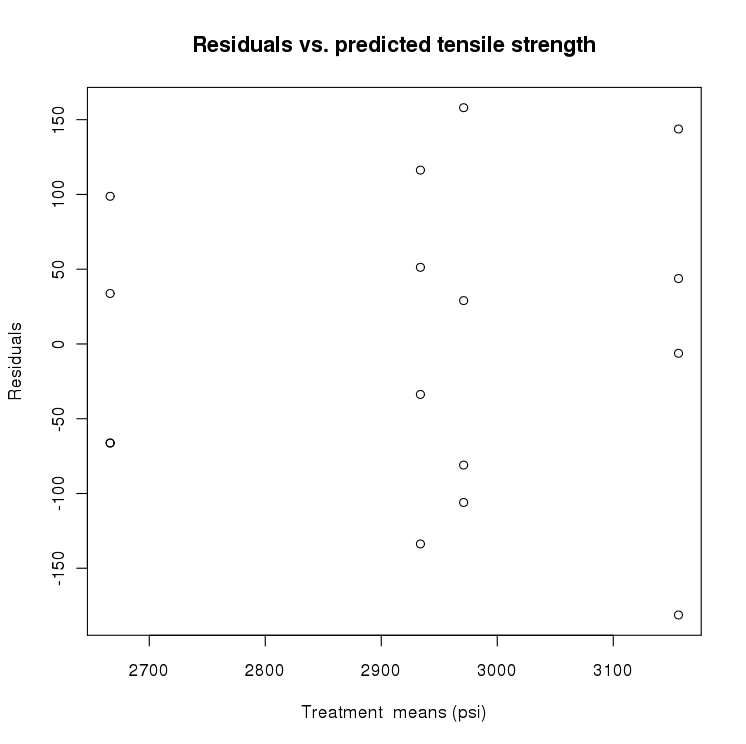
| 10:23, 31 July 2010 | 3-1e.png (file) |  |
24 KB | Statadmin (talk | contribs) | Residuals vs. predicted tensile strength. | 1 |
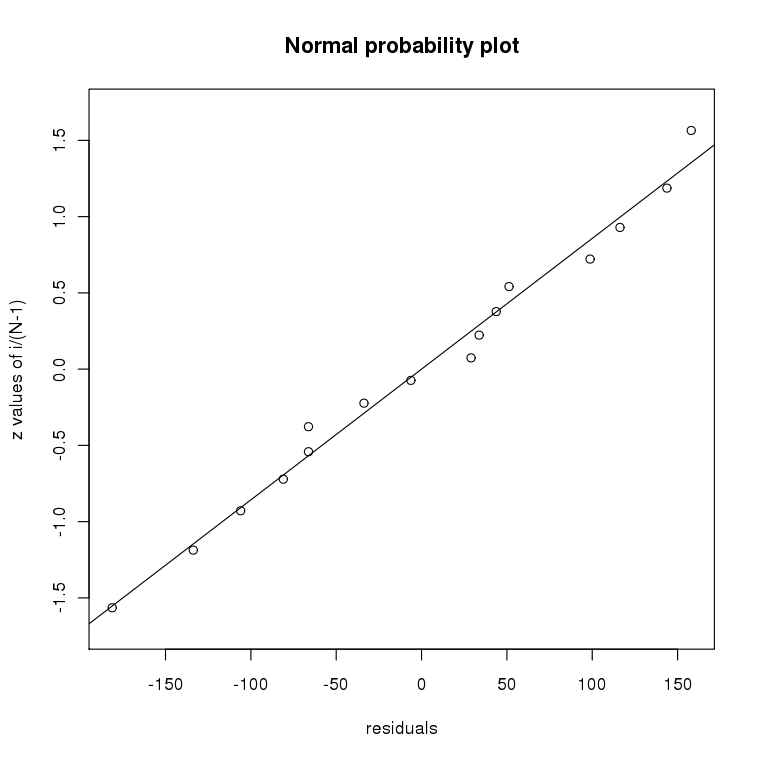
| 10:20, 31 July 2010 | Npp.png (file) |  |
31 KB | Statadmin (talk | contribs) | Normal probability plot. | 1 |
| 10:19, 31 July 2010 | 3-1b.png (file) |  |
9 KB | Statadmin (talk | contribs) | Comparison of data to a T distribution. | 1 |
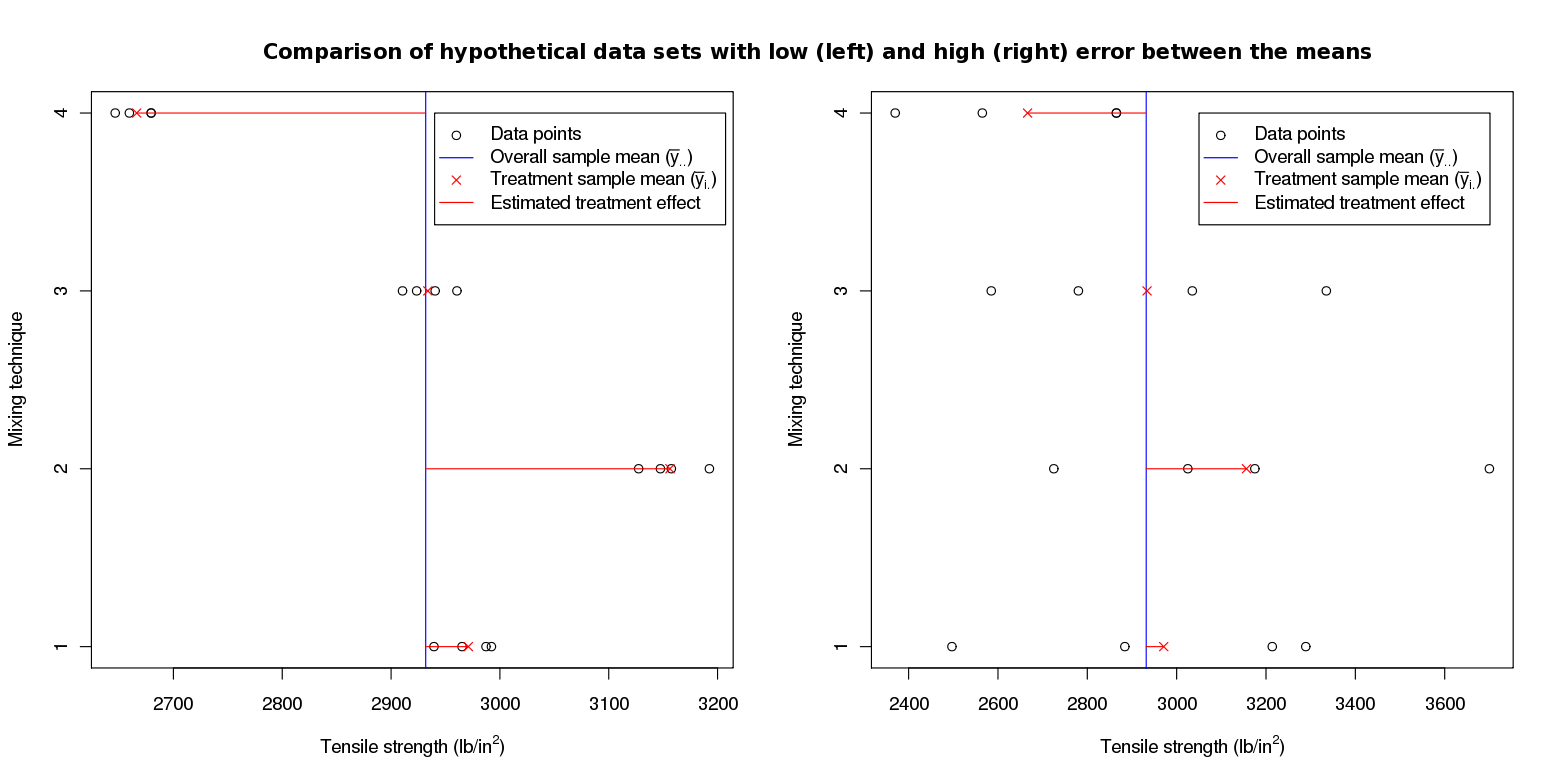
| 10:18, 31 July 2010 | 3-1error comparison.png (file) |  |
42 KB | Statadmin (talk | contribs) | Comparison of hypothetical data sets for which most of the error is between the treatment means (left) and within the treatment means (right). | 1 |
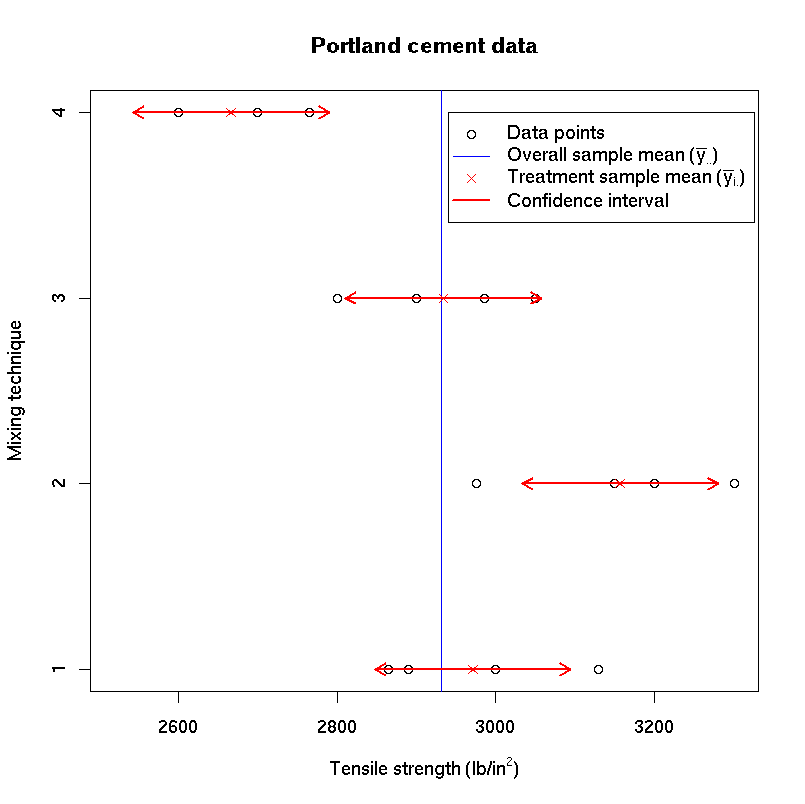
| 10:17, 31 July 2010 | 3-1dataplot.png (file) |  |
39 KB | Statadmin (talk | contribs) | Illustration of data. | 1 |
| 08:52, 31 July 2010 | 2-4fig1.png (file) |  |
49 KB | Statadmin (talk | contribs) | Confidence interval of the sample mean. | 1 |
| 08:46, 31 July 2010 | 2-2fig5.png (file) |  |
48 KB | Statadmin (talk | contribs) | The confidence interval about the theoretical mean. | 1 |
| 08:45, 31 July 2010 | 2-2fig4.png (file) |  |
49 KB | Statadmin (talk | contribs) | The confidence interval about the sample mean. | 1 |
| 08:44, 31 July 2010 | 2-2fig2.png (file) |  |
56 KB | Statadmin (talk | contribs) | Our plot after normalizing. | 1 |
| 08:43, 31 July 2010 | 2-2fig1.png (file) |  |
43 KB | Statadmin (talk | contribs) | Our data compared to a theoretical Gaussian distribution. | 1 |
| 08:09, 31 July 2010 | Gaussian5.png (file) |  |
57 KB | Statadmin (talk | contribs) | The confidence interval about the theoretical mean. | 1 |
| 08:08, 31 July 2010 | Gaussian4.png (file) |  |
51 KB | Statadmin (talk | contribs) | The confidence interval about the sample mean. | 1 |
| 08:07, 31 July 2010 | Gaussian3.png (file) |  |
62 KB | Statadmin (talk | contribs) | Illustrating the P-value. | 1 |
| 08:06, 31 July 2010 | Gaussian2.png (file) |  |
60 KB | Statadmin (talk | contribs) | Our plot after normalizing. | 1 |
| 08:04, 31 July 2010 | Gaussian1.png (file) |  |
47 KB | Statadmin (talk | contribs) | Our data compared to a theoretical Gaussian distribution. | 1 |