Problem 4-1, Randomized blocks
Problem Statement
A chemist wishes to test the effect of four chemical agents on the strength of a particular type of cloth. Because there might be variability from one bolt to another, the chemist decides to use a randomized block design, with the bolts of cloth considered as blocks. She selects five bolts and applies all four chemicals in random order to each bolt. The resulting tensile strengths follow. Analyze data from this experiment (use ) and draw appropriate conclusions.
| Bolt | |||||
|---|---|---|---|---|---|
| Chemical | 1 | 2 | 3 | 4 | 5 |
| 1 | 73 | 68 | 74 | 71 | 67 |
| 2 | 73 | 67 | 75 | 72 | 70 |
| 3 | 75 | 68 | 78 | 73 | 68 |
| 4 | 73 | 71 | 75 | 75 | 69 |
Solution

In this problem we need to compare treatments (chemical agents), but the data is being influenced by blocks (different bolts of fabric). Each datapoint can be thought of as the sum of several factors:
Where:
and:
datapoint from the th treatment and the th block
the grand mean
the effect of the th treatment
the effect of the th block
a random error affecting the datapoint from the th treatment and the th block
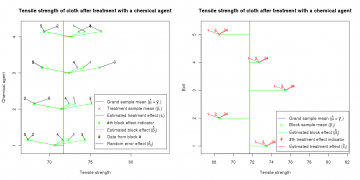
In the left plot of Figure 1, this equation is illustrated. The blue line marks the grand sample mean , and the red X marks the treatment mean (mean of all data treated by the same chemical). The green number marks where the datapoint would be if the treatment effect and block effect were present, but there was no random error. Finally, the black number marks the location of the datapoint – the sum of the grand mean and each effect. The value of the numbers indicates which block that point was affected by.
In order to examine only the effect of the chemical agent, each bolt was divided into four pieces, each of which was treated by a different chemical agent. This serves to average out the effect of the different bolts. This is displayed in the left plot in Figure 1. The green lines deviate from each treatment mean identically, illustrating that the block effect is constant across chemical treatments.
The plot on the right in Figure 1 illustrates the data similarly, but the squares indicate the block means, and the treatment effects are shown deviating from them. This is merely an alternate visualization of the sum of the grand mean and each effect.
Hypothesis Testing
As usual, our null hypothesis will be that all the treatment means are equal (and come from the same distribution). Our alternative hypothesis is that they are not all equal:
In order to test these hypotheses, we are interested in the sums of squares of all the error effects.
Each of these is a measure of its respective type of error. Graphically, in the left plot of Figure 1 is the sum of the squares of the distance along the x-axis from the grand mean to each of the black numbers. is similar, but for the x-components of the red lines. For we are summing the squares of the x-component of the green lines. And for it is the x-component of the black lines that are squared and summed (it is easier to calculate this by arithmetic as in the equation above).
By dividing the statistics above by their respective degrees of freedom, we get a normalized measure of the error effects, or a mean sum of squares.
In order to test our hypothesis, we must compare the treatment error to random error. We will do this with the F statistic, . We compare this quantity to a , which comes from the F-distribution (this can be calculated in Excel with FINV(α,a−1,N−a); in R use qf(1-alpha, a-1, (a-1)*(b-1)). If , we reject the null hypothesis. As this is not the case, we cannot reject our null hypothesis.
| Source of Variation | Sum of Squares | Degrees of Freedom | Mean Square | P-Value | ||
|---|---|---|---|---|---|---|
| Treatments (Chemical agent) | 12.95 | 3 | 4.317 | 2.376 | 3.490 | 0.121 |
| Blocks (Bolts) | 157.00 | 4 | 39.250 | |||
| Error | 21.80 | 12 | 1.817 | |||
| Total | 191.75 | 19 |